
February 2026 Local Market Statistics
- Joshua Tree Gateway AOR
- Mar 19
- 1 min read

SFR Active Listings: February 2026
Active Listings | Listings % Change LTM | Median List Price | % Active Listings w/Reduced Price | Median List Price per Sq.Ft. | Median Days Active | |
|---|---|---|---|---|---|---|
Yucca Valley | 126 | -37.9% | $476,200 | 39.7% | $280/SF | 75 |
Joshua Tree | 96 | -33.8% | $495,000 | 30.2% | $384/SF | 22 |
29 Palms | 137 | -17% | $299,000 | 41.6% | $235/SF | 52 |
SFR Sales: February 2026
| Sales Closed | # of Sales Change % LTM | Median Sold Price | Price Growth | Median DOM at Sale | Sales Over List Price % |
|---|---|---|---|---|---|---|
Yucca Valley | 9 | -69% | $339,000 | +2.7% | 60 | 11% |
Joshua Tree | 9 | -47.1% | $380,000 | -11.4% | 45 | 33% |
29 Palms | 22 | +10% | $268,000 | +5.1% | 72 | 23% |
SFR Listings, Year to Date: as of February 2026
Average Monthly Listings | % Change in Listing Inventory | Sales to List Price % | % Active Listings Reduced | ||
|---|---|---|---|---|---|
Yucca Valley | 120 | -40% | 98.7% | 37.8% | |
Joshua Tree | 86 | -38.2% | 97.7% | 28.3% | |
29 Palms | 132 | -18.6% | 98.7% | 38.8% |
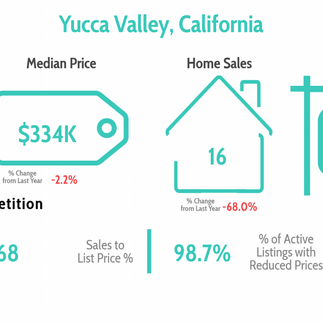
SFR Sales, Year to Date: As of February 2026
| Sales Closed | % Change LTM | Median Sold Price | Median Price Growth | Median Days on Market at Sale | Sales Over List % |
|---|---|---|---|---|---|---|
Yucca Valley | 16 | -68% | $334,500 | -2.2% | 68.5 | 6% |
Joshua Tree | 18 | -41.9% | $467,500 | +21.3% | 53 | 22% |
29 Palms | 37 | +2.8% | $247,500 | -6.5% | 70 | 22% |
Comments
Downloadable Reports and Infographics
Buyer's Guides, February 2026:


Seller's Guides, February 2026:


Market Report Infographics, February 2026:


Market Report Infographics, Year To Date as of February 2026::


San Bernardino County Statistics, February 2026:


Comments