
August 2025 Local Market Statistics
- Joshua Tree Gateway AOR
- Sep 29, 2025
- 1 min read

SFR Active Listings: August 2025
Active Listings | Listings % Change LTM | Median List Price | % Active Listings w/Reduced Price | Median List Price per Sq.Ft. | Median Listed DOM | |
|---|---|---|---|---|---|---|
Yucca Valley | 122 | -15.3% | $495,000 | 47% | $301/sqft | 89 |
Joshua Tree | 92 | -13.2% | $549,440 | 51% | $443/sqft | 126 |
29 Palms | 115 | -8.7% | $280,000 | 50% | $233/sqft | 90 |
SFR Sales: August 2025
| Sales Closed | # of Sales Change % LTM | Median Sold Price | Price Growth | Median DOM at Sale | Sales Over List Price % |
|---|---|---|---|---|---|---|
Yucca Valley | 28 | +27.3% | $392,000 | +36.5% | 74 | 18% |
Joshua Tree | 12 | +140% | $378,000 | -20.5% | 38 | 8% |
29 Palms | 13 | -18.8% | $273,000 | -5.9% | 51 | 15% |
SFR Listings, Year to Date: as of August 2025
Average Monthly Listings | % Change in Listing Inventory | Sales to List Price % | % Active Listings Reduced | |
|---|---|---|---|---|
Yucca Valley | 185 | +32.8% | 98.9% | 42.2% |
Joshua Tree | 128 | +11.5% | 96% | 42.4% |
29 Palms | 156 | +27% | 99.3% | 44.7% |
SFR Sales, Year to Date: As of August 2025
| Sales Closed | % Change LTM | Median Sold Price | Median Price Growth | Median Days on Market at Sale | Sales Over List % |
|---|---|---|---|---|---|---|
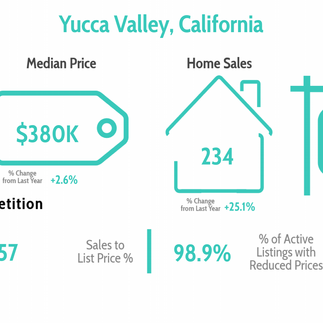
Yucca Valley | 234 | +25.1% | $379,500 | +2.6% | 57 | 22% |
Joshua Tree | 125 | +64.5% | $385,500 | +1.4% | 56 | 12% |
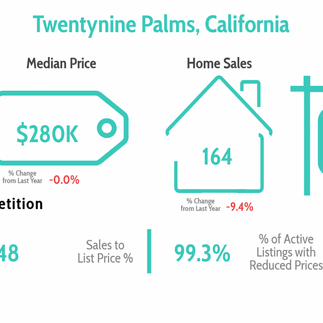
29 Palms | 164 | -9.4% | $279,950 | 0% | 48.5 | 21% |
Downloadable Reports and Infographics
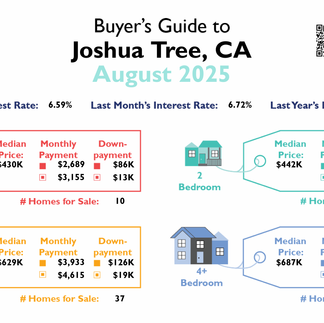
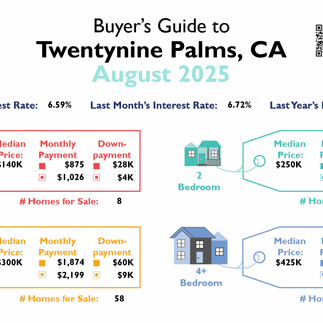
Buyer's Guides, August 2025:


Seller's Guides, August 2025:


Market Report Infographics, August 2025:


Market Report Infographics, Year To Date as of August 2025:


County Statistics, August 2025:
Upcoming Events at JTGAR:


Comments