

July 2025 Local Market Statistics
- Joshua Tree Gateway AOR
- Aug 22, 2025
- 1 min read

SFR Active Listings: July 2025
Active Listings | Listings % Change LTM | Median List Price | % Active Listings w/Reduced Price | Median List Price per Sq.Ft. | Median Listed DOM | |
|---|---|---|---|---|---|---|
Yucca Valley | 128 | -22% | $499,000 | 47% | $291/sqft | 82.5 |
Joshua Tree | 98 | -17% | $510,500 | 53% | $414/sqft | 111 |
29 Palms | 136 | +3% | $237,000 | 53% | $233/sqft | 92 |
SFR Sales: July 2025
| Sales Closed | # of Sales Change % LTM | Median Sold Price | Price Growth | Median DOM at Sale | Sales Over List Price % |
|---|---|---|---|---|---|---|
Yucca Valley | 29 | -3.3% | $380,000 | +3.6% | 62 | 31% |
Joshua Tree | 12 | -20% | $317,000 | -4.1% | 38 | 8% |
29 Palms | 26 | +4% | $306,000 | +13.1% | 81 | 27% |
SFR Listings, Year to Date: as of July 2025
Average Monthly Listings | % Change in Listing Inventory | Sales to List Price % | % Active Listings Reduced | |
|---|---|---|---|---|
Yucca Valley | 194 | +39.9% | 98.9% | 41.9% |
Joshua Tree | 134 | +14.7% | 96% | 41.5% |
29 Palms | 162 | +32.2% | 99.4% | 44.3% |
SFR Sales, Year to Date: As of July 2025
| Sales Closed | % Change LTM | Median Sold Price | Median Price Growth | Median Days on Market at Sale | Sales Over List % |
|---|---|---|---|---|---|---|
Yucca Valley | 206 | +24.8% | $375,000 | -1.3% | 54 | 22% |
Joshua Tree | 113 | +59.2% | $386,000 | +2.8% | 58 | 12% |
29 Palms | 151 | -8.5% | $280,000 | +0% | 48 | 22% |
Downloadable Reports and Infographics
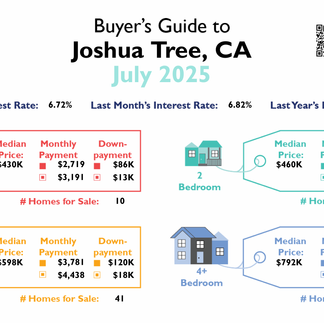
Buyer's Guides, July 2025:


Seller's Guides, July 2025:


Market Report Infographics, July 2025:


Market Report Infographics, Year To Date as of July 2025:


County Statistics, July 2025:
Upcoming Events at JTGAR:

Comments