

June 2025 Local Market Statistics
- Joshua Tree Gateway AOR
- Jul 21, 2025
- 1 min read

SFR Active Listings: June 2025
Active Listings | Listings % Change LTM | Median List Price | % Active Listings w/Reduced Price | Median List Price per Sq.Ft. | Median Listed DOM | |
|---|---|---|---|---|---|---|
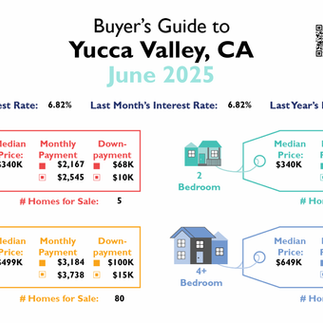
Yucca Valley | 158 | +1.9% | $499,000 | 47.5% | $286/sqft | 75 |
Joshua Tree | 106 | -15.2% | $516,000 | 48.6% | $410/sqft | 90 |
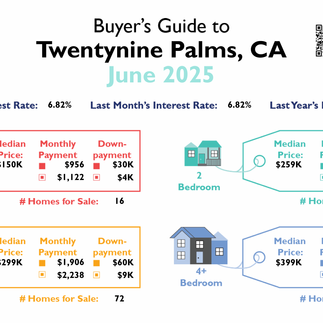
29 Palms | 146 | +12.3% | $294,750 | 48.6% | $242/sqft | 83 |
SFR Sales: June 2025
| Sales Closed | # of Sales Change % LTM | Median Sold Price | Price Growth | Median DOM at Sale | Sales Over List Price % |
|---|---|---|---|---|---|---|
Yucca Valley | 28 | +40% | $413,000 | +1.4% | 40 | 29% |
Joshua Tree | 12 | -7.7% | $340,000 | -9.2% | 73 | 8% |
29 Palms | 20 | -39.4% | $322,000 | +12% | 66 | 5% |
SFR Listings, Year to Date: as of June 2025
Average Monthly Listings | % Change in Listing Inventory | Sales to List Price % | % Active Listings Reduced | |
|---|---|---|---|---|
Yucca Valley | 205 | +52.5% | 98.9% | 41.4% |
Joshua Tree | 140 | +20.1% | 95.9% | 40.1% |
29 Palms | 167 | +37.6% | 98.4% | 43.1% |
SFR Sales, Year to Date: As of June 2025
| Sales Closed | % Change LTM | Median Sold Price | Median Price Growth | Median Days on Market at Sale | Sales Over List % |
|---|---|---|---|---|---|---|
Yucca Valley | 177 | +31.1% | $375,000 | -2.6% | 54 | 21% |
Joshua Tree | 101 | +80.4% | $395,000 | +1.5% | 58 | 13% |
29 Palms | 125 | -10.7% | $280,000 | -1.2% | 46 | 21% |
Downloadable Reports and Infographics
Buyer's Guides, June 2025:


Seller's Guides, June 2025:


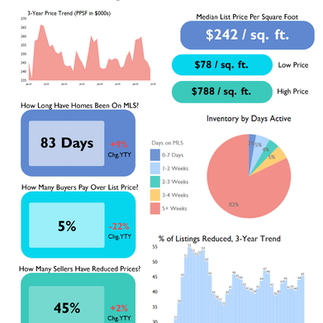
Market Report Infographics, June 2025:


Market Report Infographics, Year To Date as of June 2025:


County Statistics, June 2025:


Comments