
March 2026 Local Market Statistics
- Joshua Tree Gateway AOR
- 3 days ago
- 1 min read

SFR Active Listings: March 2026
Active Listings | Listings % Change LTM | Median List Price | % Active Listings w/Reduced Price | Median List Price per Sq.Ft. | Median Days Active | |
|---|---|---|---|---|---|---|
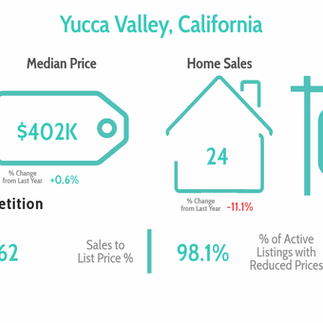
Yucca Valley | 126 | -43% | $476,200 | 38.1% | $289/SF | 62 |
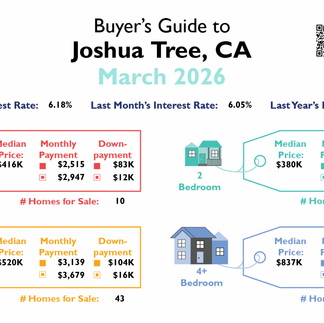
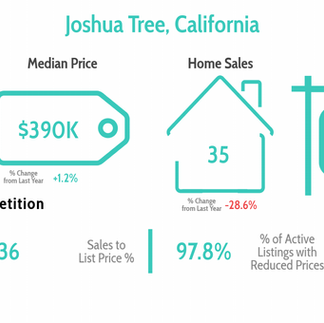
Joshua Tree | 104 | -30.2% | $495,000 | 35.6% | $373/SF | 32 |
29 Palms | 133 | -23.6% | $299,000 | 41.4% | $249/SF | 38 |
SFR Sales: March 2026
| Sales Closed | # of Sales Change % LTM | Median Sold Price | Price Growth | Median DOM at Sale | Sales Over List Price % |
|---|---|---|---|---|---|---|
Yucca Valley | 24 | -11.1% | $402,000 | +0.6% | 62 | 12% |
Joshua Tree | 17 | -5.6% | $361,000 | -5% | 32 | 24% |
29 Palms | 16 | -36% | $307,000 | +13.7% | 38 | 19% |
SFR Listings, Year to Date: as of March 2026
Average Monthly Listings | % Change in Listing Inventory | Sales to List Price % | % Active Listings Reduced | ||
|---|---|---|---|---|---|
Yucca Valley | 122 | -41.1% | 98.3% | 37.9% | |
Joshua Tree | 92 | -35.4% | 97.8% | 31% | |
29 Palms | 132 | -20.3% | 98.6% | 39.6% |
SFR Sales, Year to Date: As of March 2026
| Sales Closed | % Change LTM | Median Sold Price | Median Price Growth | Median Days on Market at Sale | Sales Over List % |
|---|---|---|---|---|---|---|
Yucca Valley | 40 | -48.1% | $398,000 | +8.7% | 68 | 10% |
Joshua Tree | 35 | -28.6% | $390,000 | +1.2% | 36 | 23% |
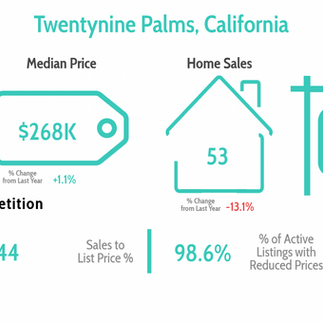
29 Palms | 53 | -13.1% | $268,000 | +1.1% | 44 | 21% |
Downloadable Reports and Infographics
Buyer's Guides, March 2026:


Seller's Guides, March 2026:


Market Report Infographics, March 2026:


Market Report Infographics, Year To Date as of March 2026:


San Bernardino County Statistics, March 2026:


Comments